Summer of 2012: interactive weather map
After the wettest summer in 100 years, our interactive map pulls together the highlights of what has been a summer to remember – even if for the wrong reasons. Click on the map for more information.
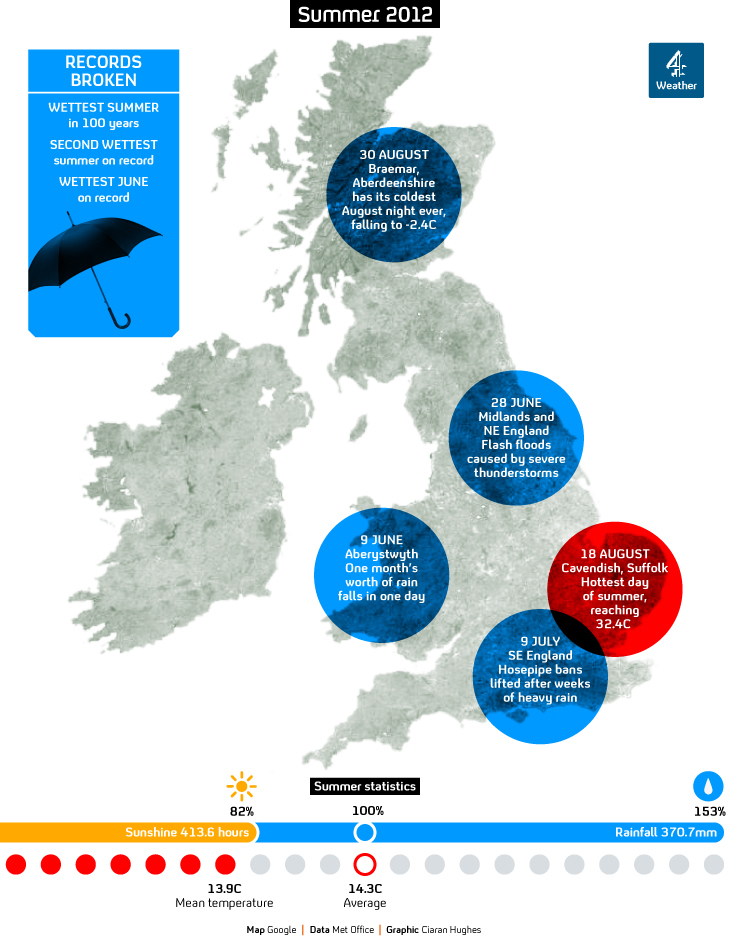
As well as being the wettest in 100 years, summer 2012 is also the second wettest on record, pushing the notoriously wet summer of 2007 into third place in the rankings.
The cause of the wet summer is the position of the jet stream. It’s been stuck to the south of the UK for much of the summer, steering low pressure systems towards us, bringing heavy rain and strong winds.
A large swathe of England was officially in drought at the start of the summer, but after the wettest April and June on record, we’ve gone from one extreme to another – droughts to floods in a matter of months.
Summer 2012 in numbers
- Sunshine was below normal at 413.6 hours, 82 per cent of average.
- Rainfall was well above normal at 370.7mm, 153 per cent of average.
- Mean temperature for the UK was 13.9C, 0.4C below average.
-
Latest news
-
Post Office scandal: workers react to ex-CEO Vennells at inquiry4m

-
Election 2024: what voters think of Rishi Sunak announcement3m
-
Post Office inquiry: former boss Vennells admits evidence was false5m
-
‘We are going after every vote we possibly can’, says deputy leader of Liberal Democrats4m
-
What’s the mood in Wales for an early general election?7m
-


