
The claim
“Inequality is at its lowest since 1986. There are 300,000 fewer children in child poverty than when I became Prime Minister. There are half a million fewer people in relative poverty than at the election.”
David Cameron, 11 June 2014
The background
Child poverty and inequality came up during prime minister’s questions today, with Labour MP Ian Lavery asking: “Would the prime minister agree with me that something went wrong, sadly, with regard to child poverty, and can he say – please, please, tell me – where it all went wrong in the first place?”
David Cameron was having none of it, saying inequality was at its lowest since 1986 and that child poverty and relative poverty in general had fallen on his watch.
It’s a massive issue: all governments have a legal duty to “eradicate” child poverty by 2020, as defined by various targets, and will be held to account. What’s the story so far?
The analysis
 “Inequality is at its lowest since 1986.”
There are a number of ways of measuring income inequality. Mr Cameron is referring to the Gini coefficient here. It’s usually expressed as a number between 0 and 1 or a percentage between 0 and 100 per cent, where zero means everyone earns the same, and 100 means all the income goes to one person.
The latest ONS stats say Mr Cameron is right: the Gini coefficient for disposable income was 32.3 per cent in 2011/12, the lowest level since 1986.
It has to be said that the number has not changed much since the mid-1980s. It has generally hovered between 32 and 36 for most of the last 25 years:

In the long term, the United Kingdom has high levels of income inequality compared to other leading economies. The OECD group of developed economies currently ranks the UK in 28th place out of its 34 members.
Labour ministers have admitted they failed to make headway on inequality during their 13 years in power.
 “There are 300,000 fewer children in child poverty than when I became Prime Minister. There are half a million fewer people in relative poverty than at the election.”
There is no single definitive measure of child poverty. The official statistics track a huge number of different trends, and the Child Poverty Act 2010 uses four different measures to define government targets.
Mr Cameron’s words are true if we are talking about relative poverty, defined as the number of people earning less than 60 per cent of the average income in the year in question, and if we use the financial year 2009/10 as the benchmark.
The number of children in relative poverty fell from 2.6 to 2.3 million between 2009/10 and 2011/12 (the latest year we know about) and the number of people of all ages fell from 10.3 to 9.8 million.
But if we choose a different measure of poverty the picture is very different.
Absolute poverty – how many people earn 60 per cent of the average income in the year 2010/11, adjusted for inflation – has gone up not down over the last three years, for children and for the whole population.
In fact, the trend for the number of children in absolute poverty is exactly the reverse of the statistic quoted by the prime minister: it has risen from 2.3 million to 2.6 million since 2009/10.
We’re not in a position to say that one measure is better than another. It’s probably better to consider them together and look at the long-term trends.
This is what this graph does: it looks at child poverty as a percentage of the population rather than in raw numbers. The top three lines are measures used to fix official government targets (BHC means “before housing costs”).

We can see that there were significant falls in relative and absolute child poverty from the late 1990s to the mid 2000s. Poverty rose slightly from about 2005 to 2008, before beginning to fall again.
Since the coalition came to power three out of the four measures tracked here have continued a downward trend that began under the previous government, and one – absolute poverty before housing costs – has gone up.
So there are figures around that back up Mr Cameron. Inequality and poverty have fallen under this government – on one measure.
On the other hand, the prime minister isn’t giving the fairest possible summary of the long-term poverty trends here. He is choosing his figures selectively to put the government’s record in the best possible light.
And some commentators have disputed how much credit the current administration can justifiably take for the recent trends, some of which arguably reflect policy decisions taken before the coalition came to power.
The Child Poverty Action Group says: “The fall of 300,000 between 2009/10 and 2010/11 has to be largely attributed to legacy policies of the Labour government, including above-index increases to child tax credit.”
What happens next?
So much for what happened to child poverty in the past – the big question is what the future will bring.
The Child Poverty Act, which became law with all-party support in 2010, says successive governments must hit a range of tough child poverty targets by 2020: relative income poverty should be below 10 per cent, relative low income and material deprivation less than 5 per cent and absolute poverty less than 5 per cent. The target for persistent poverty has not yet been set.
Various people including the work and pensions secretary, Iain Duncan Smith, have suggested that some of these measures are unhelpful, but the government has failed to come up with a replacement model.
Mr Duncan Smith has said that he believes current policies “will reduce child poverty in line with our commitments”. But independent economists who have modelled the future effects of current government policies say otherwise.
The Institute for Fiscal Studies estimates that, far from falling, “in 2020 relative child poverty will be at its highest rate since 1999 and absolute child poverty will be at its highest rate since 2001”.
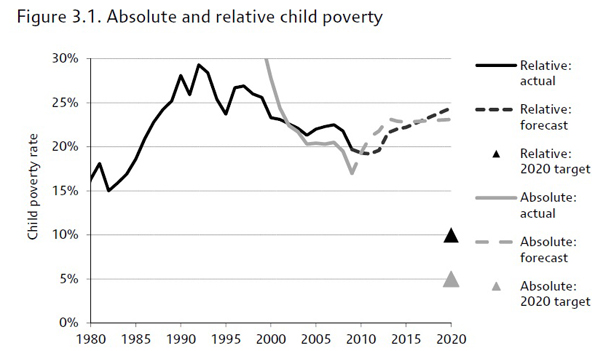
Economists from the National Institute for Economic and Social Research (NIESR) forecast that: “Child poverty in 2020 on the relative BHC poverty measure will be 21 percent – 3.5 percentage points higher than in 2011-12 (the most recent year for which figures are currently available), and 11 percentage points above the target level of 10 per cent.
“Meanwhile, absolute child poverty in 2020 is forecast to be just over 24 per cent – 19 percentage points above the target level of 5 per cent.”
The cross-party Social Mobility and Child Poverty Commission drew on NIESR’s research in its report last week, which concluded that: “3.5 million children will be in absolute poverty – almost 5 times the number needed to meet the government’s legal obligation to end child poverty by 2020 – and that the government lacks any credible plan to get back on track”.


