 The claim
“Data shows five excess child deaths per day in UK compared to Sweden”
Department of Health announces the chief medical officer’s 2012 Report into Child Health
The background
Child health in Britain is a cause for concern. Our northern neighbour Sweden has much better outcomes.
But though the headline statistic from the Department of Health seems to drastically illustrate that point – five excess child deaths per day in UK compared to Sweden – it is confusing for the reader.
There are approximately six times more children in Britain (population 63m) , than in Sweden ( population 9.5m) – so it’s hard to tell whether the five deaths a day difference is just because there are more people. And if so, why that is useful as a basis for medical policy.
The analysis
The five deaths a day statistic cited by the Department of Health is taken from a paper in the medical journal, the Lancet. Health services for children in western Europe was published in April 2013.
For anyone wanting a quick comparison of the two countries, the best statistic is the ratio of deaths per 100,000 children. In Sweden there are 29.27 deaths per 100,000 children aged 0-14 a year. In the UK the rate is 47.77 a year.
That puts the UK near the bottom of a list of 15 western European countries and means that there are 1.6 times more child deaths per 100,000 kids in Britain than in Sweden.
That doesn’t reflect well on Britain. This the table from the article:
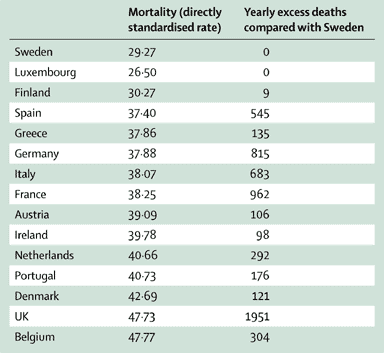
Source: WHO Mortality Database, 2012.2 Directly standardised rate data show all-cause mortality per 100 000 children aged 0–14 years and are 5 year means for 2006–10, except for France and Luxembourg (2005–09), Denmark (2002–06), Belgium (1998–99; 2004–06), Italy (2003; 2006–09); and Portugal (2003; 2007–10). Data for excess deaths are absolute numbers. An estimated 6198 deaths would have been avoided if the child mortality rate across the 15 pre-2004 countries of the European Union was the same as that in Sweden.
But the cold figure – the absolute number of child deaths – is a bit more confusing. For the purposes of the table in the Lancet paper, Sweden is taken as the gold standard of best practice in child health care, and so a scale is created with the number of child deaths in Sweden reset to zero. Anything above the total number in Sweden is listed out country by country in this table. This is an absolute number – not adjusted relative to total population.
Looking at those numbers, 1951 more British children die a year than Swedish children. That difference could be divided by 365 to find the number who – very approximately – die each day. That would be five (or 5.3 to be more accurate), the statistic in the Department of Health statement. That’s where the figure comes from – and it’s interesting to compare Britain to France, which has a comparable population (65.7m) and a much lower number of child deaths.
But is it useful as a standalone statistic?
The verdict
The five more child deaths a day is arguably correct – and an attempt to humanise a data set where each number represents a terrible tragedy.
Looking at excess or avoidable deaths is also extremely important because that is where hospitals and health services can make a difference. Clearly even a flawless health system cannot save every life.
But this five more deaths a day figure needs to be put in context to make it meaningful.
And a reader seeking to compare child mortality in Sweden with Britain would get a better understanding of the situation by looking at the ratio comparison. It’s clear enough from that: 29.27 per 100,000 in Sweden, 47.77 per 100,000 in Britain – that Sweden is doing something well that Britain isn’t.
Back over to the chief medical officer for suggestions on improving that.


