Census 2011: Sharp rise in foreign-born residents
The latest census reveals crucial changes in how we live today, including a rise in immigration to the UK, population and education level, and a drop in religion, marriage and mortgage owners.

Every 10 years, the census for England and Wales holds a mirror up to society, providing the most comprehensive picture of the way we live – and how this has changed over time.
The most recent census for 2011, released by the Office for National Statistics (ONS), shows a significantly more ethnically diverse society and a rise in immigration, with 13 per cent of residents born abroad – up from 9 per cent in 2001, and 7 per cent in 1991.
In total, that is a rise of 2.9 million foreign-born residents to 7.5 million, meaning that foreign-born residents are largely responsible for an overall four million rise in population, to 56.1 million in England and Wales.
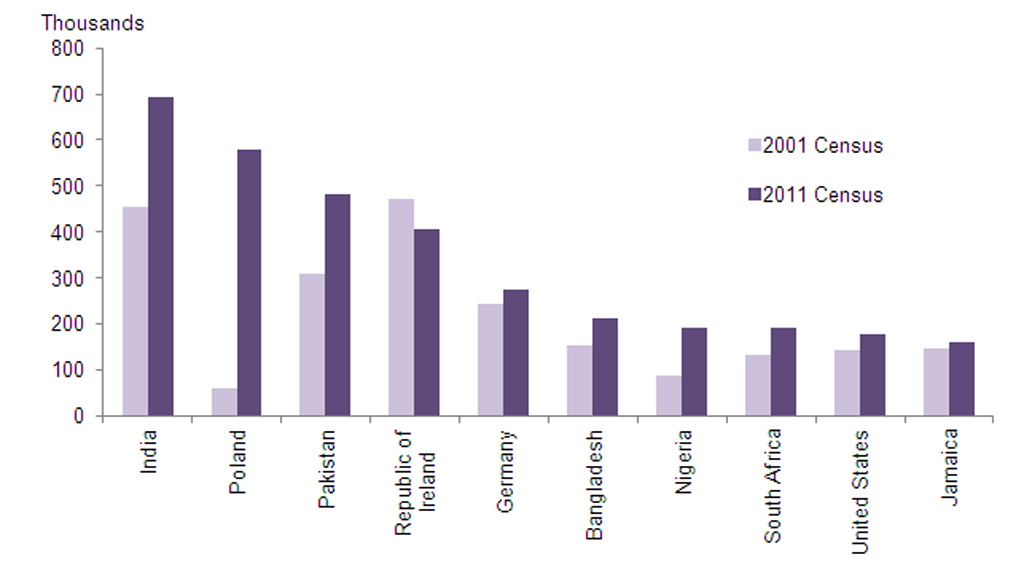
Residents from Poland saw the biggest increase by far – ten-fold since 2001 – but India tops the immigration table, with almost 700,000 Indian-born residents now living in the UK [see graph below].
At 80 per cent, white Britons still make up the vast majority of the population. However this drops to 45 per cent in London, which has the top ten most ethnically diverse areas in England and Wales.
Religion
The most recent data also shows that we are becoming less religious: around a quarter of the population, or 14.1 million, say they have “no religion”, compared to 15 per cent a decade ago, while the number of Christians has fallen from 72 to 59 per cent.
Christianity was still the biggest religion, but the number of Muslims increased the most, from 3 per cent in 2001, to 4.8 per cent.
Of the so-called “other” religions, the force appears to be fading: nearly 180,000 people describe themselves as Jedi Knights, compared to around 330,000 in 2001. This compares with 6,242 affiliating themselves to “heavy metal”, 1,893 Satanists, and 650 New Age.
Marriage: I don’t?
In terms of marital status, marriage is still the largest group overall at 47 per cent (21.2 million) but this is a four per cent drop from the 2001 figure of 51 per cent. The percentage of single people increased by five per cent to 30 per cent (12.5 million), while the number of divorcees increased slightly from 8.2 per cent to 9 per cent.
Following the economic recession of 2008, it is perhaps little surprise that home ownership is down. Sixty-four per cent of households, or 14.9 million, owned their own home in 2001 – down from 68 per cent since 2001 – but the number of people who owned their home outright increased by two percentage points to 31 per cent.
Read more: Ethnicity mapped over time
Daily life
In contrast, renting has risen from 9 per cent in 2001, to 15 per cent (3.6 million) in 2011.
The percentage of the population with degree-level education has risen to 27 per cent from 23 per cent in 2001.
London was the only region where the number of cars and vans was lower than the number of households. But overall, the number of cars and vans available for use by households in England and Wales increased from 23.9 million to 27.3 million between 2001 and 2011.
Foreign-born residents
Of the 2.9 million increase in foreign-born nationals living in England and Wales, almost 40 per cent arrived between 2004 and 2011, showing the impact of the expansion of the EU to include central and eastern EU countries, including Poland.
The only ethnic minority group that has decreased in the UK is white Irish, which fell from 1.2 per cent to 0.9 per cent of the population in 2011.
-
Latest news
-
As India goes to the polls in the world’s largest election – what do British-Indians think?6m

-
Tees Valley: Meet the candidates in one of the biggest contests coming up in May’s local elections4m
-
Keir Starmer says public sector reform will be a struggle7m
-
Nicola Sturgeon’s husband Peter Murrell charged with embezzlement of funds from SNP1m
-
Ukraine might finally get $60billion in American weapons and assistance to defend against Russia3m
-


